


1
2
3
4
5
6
7
8
9
10
OSTEOIMAGER Product Photograph
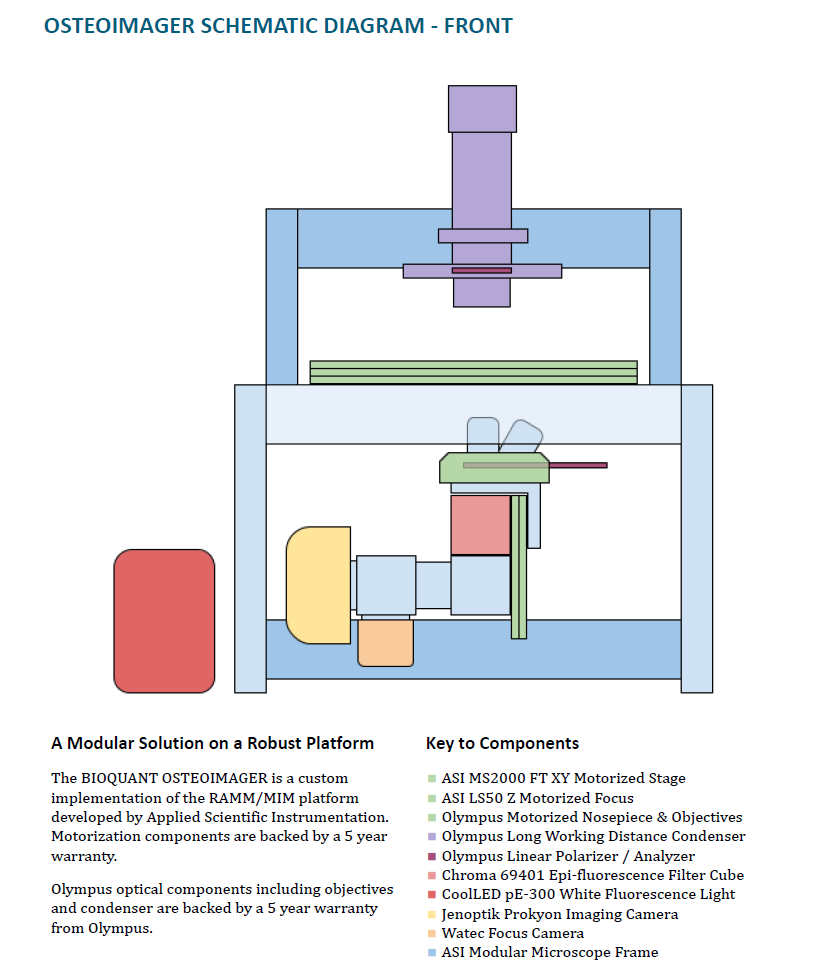
OSTEOIMAGER Schematic Diagram - Front
OSTEOIMAGER Schematic Diagram - Side
OSTEOIMAGER Schematic Diagram - Fluorescence Pathway
Bright Field Imaging
Examples of non-demineralized histology. Osteoclasts, osteoblasts, adipocytes, osteocytes, osteoid.
Live Multicolor Fluorescence Mixing
Left column: reduced excitation. Right column: increased excitation. First two rows: individual label viewing. Last row: live dual label viewing. 20X objective. Calcein and alizarin red labels.
Live Multicolor Fluorescence Examples
20X objective. 0.4 microns per pixel. Trabecular bone. Calcein and alizarin red labels. Blue autofluorescence in mineralized bone. Hardware brightness adjustment and simultaneous viewing. Live black background correction is also applied in hardware. No software post processing required.
Fluorescence Scan
Representative multi-channel fluorescence scan of distal mouse femur at 0.3 micron per pixel resolution. Simultaneous viewing of calcein and alizarin red labels for bone formation rate. No software image merging step required. Both labels are imaged simultaneously.
Bright Field Scan
Representative trichrome scan of distal mouse femur at 0.3 micron per pixel resolution.
Polarization and Dark Field
Top: Ground Cortical Bone Cross-Section
Middle: Same field-Darkfield Illumination
Bottom: Same field - Linear Polarized Illumination